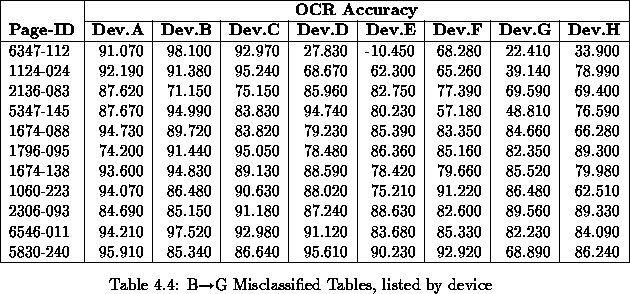
The 15 ``B G'' misclassifications (Table 4.2)
were carefully examined. The page images did not present substantial
degradation, confirming the results of the
classifier. Figure 4.2 shows excerpts from some of these
images where the quality can be appreciated.
Figure 4.2: Excerpts from B->G misclassified images (magnified)
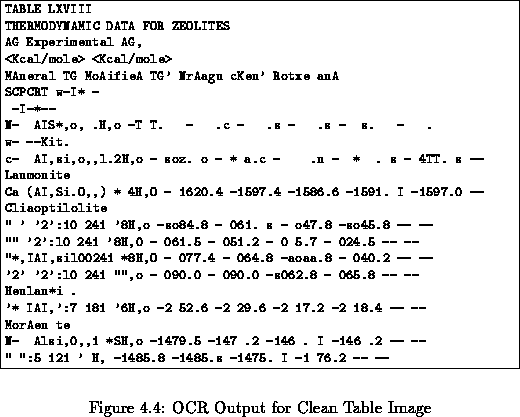
All but 4 of these 15 ``problematic'' pages contained tables in them. The OCR output for many of these tables were illegible and generally useless. Figures 4.3 and 4.4 show a clean table image and its associated OCR output. Tables pose special problems to OCR devices.
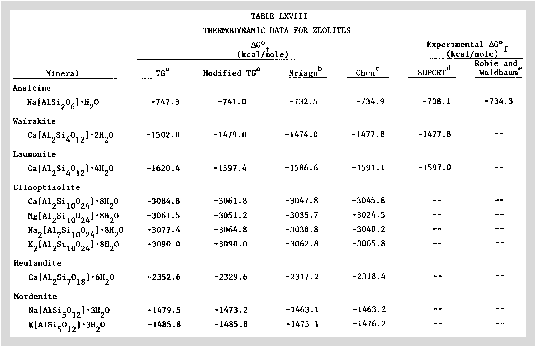
Figure 4.3: Clean table image
The classifier labeled all these 11 pages containing tables ``Good''
because, from an image defects point of view, it could not find enough
evidence to give the pages a ``Bad'' label. The contents of these
pages, however, suggest that table-generated OCR errors are special
and, therefore, are not related to image-generated OCR errors. After
evaluating all 11 ``Bad Good'' misclassified ``table
pages'', the following observations are in order:
It is important to make clear that none of these three observations
are dependent on page quality. Furthermore, after visually inspecting
the images, tables that presented poor image quality were in general
correctly flagged as ``Bad'' by the classifier and their OCR output
was subject to the normal image quality-related errors (in addition to
the special problems posed by tables and mentioned above). Similarly,
pages labeled as ``Good'' by the classifier were visually inspected
and found to indeed have high image quality. Some of these pages were
considered ``Bad'' in the experiment because their low OCR accuracy
stem from the special characteristics of tables mentioned above and
not from image defects. Furthermore, many of the ``BG''
pages would not be misclassified if the devices used in the experiment
had been a selected subset of the ones used. This variability in OCR
output is not usual in ``normal'' textual pages.
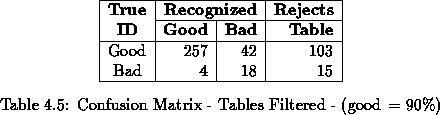
Therefore, a reject region was established to filter-out all the pages containing tables. These pages would need to be processed by another type of classifier since the difficulty they present to OCR algorithms does not result from image quality, but from the complexity of their contents and layout. Table 4.5 shows the confusion matrix with the addition of the Table Reject column. All the pages with tables in them were not processed by the classifier and were assigned to the Table Reject column.
The Error and Reject Rates are now:
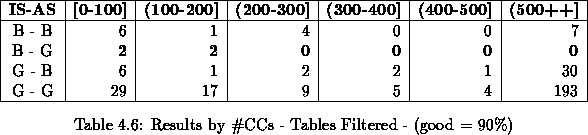
After examining the results analyzed by the number of connected components on the page (see Table 4.6), it can clearly be seen that a reject zone for any page with 200 connected components or less has to be implemented.
The rationale behind this decision takes root in that this classifier is based in measured ratios. Pages with a low number of connected components are not ``stable'' enough to present credible ratios, since a little variation can result in a very high (or low) ratio. Therefore, having a cutoff number is a requirement to make the classifier robust.
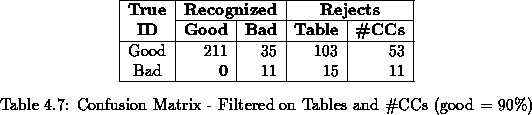
The results obtained after applying this new filter are shown in
Table 4.7, where no ``BG''
misclassifications exist.
These last results produce the following Error / Reject Rates:
In this case, however, there are no ``B G''
misclassifications, which was a desired goal with regards to quality
control.
There are a considerable number of ``GB''
misclassifications. After evaluating the misclassified pages as well
as the triggered rules that produced the misclassifications, the
following considerations are in order: